Getting the most
out of patient encounter data with HQI
It’s no surprise that organizations struggle to put their patient encounter data to good use. Implementing an end-to-end solution that is robust, fast, and secure is no easy task. Here’s how we did it.

Hospital Quality Improvement Platform (HQIP)
The Hospital Quality Institute (a division of the California Hospital Association) needed an end-to-end solution for patient data management and analytics. Partnered with SpeedTrack, NewVolt developed a bespoke data management and analytics platform.
Members upload the same patient encounter data that they are required to report to the California Department of Health Care Access and Information. Our platform then calculates various quality measures and derived data and displays the results as a series of dynamic and interactive dashboards.
What Didn't Work
Before dedicating the resources needed to build a new platform from scratch, we searched for a simpler solution. We knew there wasn't a single tool that could do exactly what we needed, but maybe we could cobble together a few existing technologies.
Traditional Business Intelligence (BI) Tools
Plenty of dashboard tools exist, like Tableau, Qlik, and Power BI, but we found these to be lacking. The most common use case for BI tools is internal use only. Trying to use these tools for customer-facing analytics didn't fit well.
They are expensive
Paying per user when you have hundreds of users can make these solutions infeasible.
They are not flexible enough
From managing complex access permissions to requiring fine-tuned query optimization, these tools fell short.
They only address half the problem
Even with a BI tool, we would still need to build the full data pipeline and upload interface.
No-Code/Low-Code Platforms
We next looked at tools that have a bit more control and flexibility, without going fully custom. Some examples are Superset, Metabase, Sisense, and Looker.
Still too expensive
While a bit more affordable when configured correctly, we still didn't like paying per user.
Still not flexible enough
While you could have more control over your queries, these tools still failed to handle complex cases—such as peer-group comparisons—without sacrificing speed or security.
Still only address half the problem
These tools don't handle user uploads, validation, and data transformations.
What Did Work
It quickly became clear that building custom was the right choice. This would be a challenge, but with HQI's domain expertise and NewVolt's app development experience, we were confident that we could achieve a good result.
Code First with Open Source Libraries
To get exactly what you want, you need to write a lot of your own code. There are no shortcuts here.
However, we found open source libraries very useful along the way, namely Directus, Plotly, and Pandas.
Powerful Database Technology
With tens of millions of patient encounters to process, our dashboards are only as fast as the underlying database technology allows.
We found Postgres to be too slow for analytical queries and Redshift to have too much latency. We ultimately settled on ClickHouse, which allows us to query tens of millions of rows in milliseconds.
Cloud Hosting Services
A deep knowledge of AWS was essential for keeping costs down, keeping the application up and running at all times, and keeping the security analysts happy.
Nearly all modern apps rely on cloud hosting, but we found a deep knowledge of low-level AWS services to be essential.
The Result
The end product is a robust platform tailored exactly to HQI's needs, with the main features detailed below.
Quality Measures and Indicators
The platform draws from numerous data sources and healthcare authorities to provide a comprehensive view of hospital quality. Starting with ICD-10 diagnosis and procedure codes, demographic information, and other information about the patient encounter, NewVolt derives many measures and reports, such as:
- Mortality rates
- Lengths of stay
- MS-DRG groupings
- Sepsis rates
- CMS case mix index
- Adverse Drug Events
- Readmission rates
- Acuity levels
- Social determinants of health
- Healthcare-associated infections
- AHRQ quality indicators
- California Maternal Quality Care Collaborative (CMQCC) Measures
- CMS chronic conditions data warehouse (CCW) rates
- HCUP Clinical Classifications Software Refined (CCSR) groupings
- Elixhauser comorbidity
- ...and more
Comparative Analytics
Data needs context. HQIP focuses heavily on benchmarking your facility against peers. Comparison groups are available at many levels, from the whole state down to your specific facility size and principal service type (and many more).
NewVolt calculates AHRQ quality indicators like Patient Safety (PSI), Inpatient Quality (IQI), Pediatric Quality (PDI), Sepsis Mortality/Incidence, and more to give HQI members established measures as a basis for comparison and improvement.
- State-wide and Regional Benchmarking: Hospitals can compare patient encounter statistics with broader datasets to assess relative performance.
- Aggregate Analysis: System-wide comparisons allow healthcare networks to measure variations across multiple facilities.
- AHRQ Quality Indicators: The platform incorporates standardized metrics such as Patient Safety Indicators (PSI), Inpatient Quality Indicators (IQI), Pediatric Quality Indicators (PDI), and the Hospital-Acquired Conditions (HAC) Reduction Program.
- Customizable Insights: Hospitals can filter and analyze data across multiple dimensions, including diagnosis categories, patient demographics, and length of stay.
Diagnosis Signal Detection
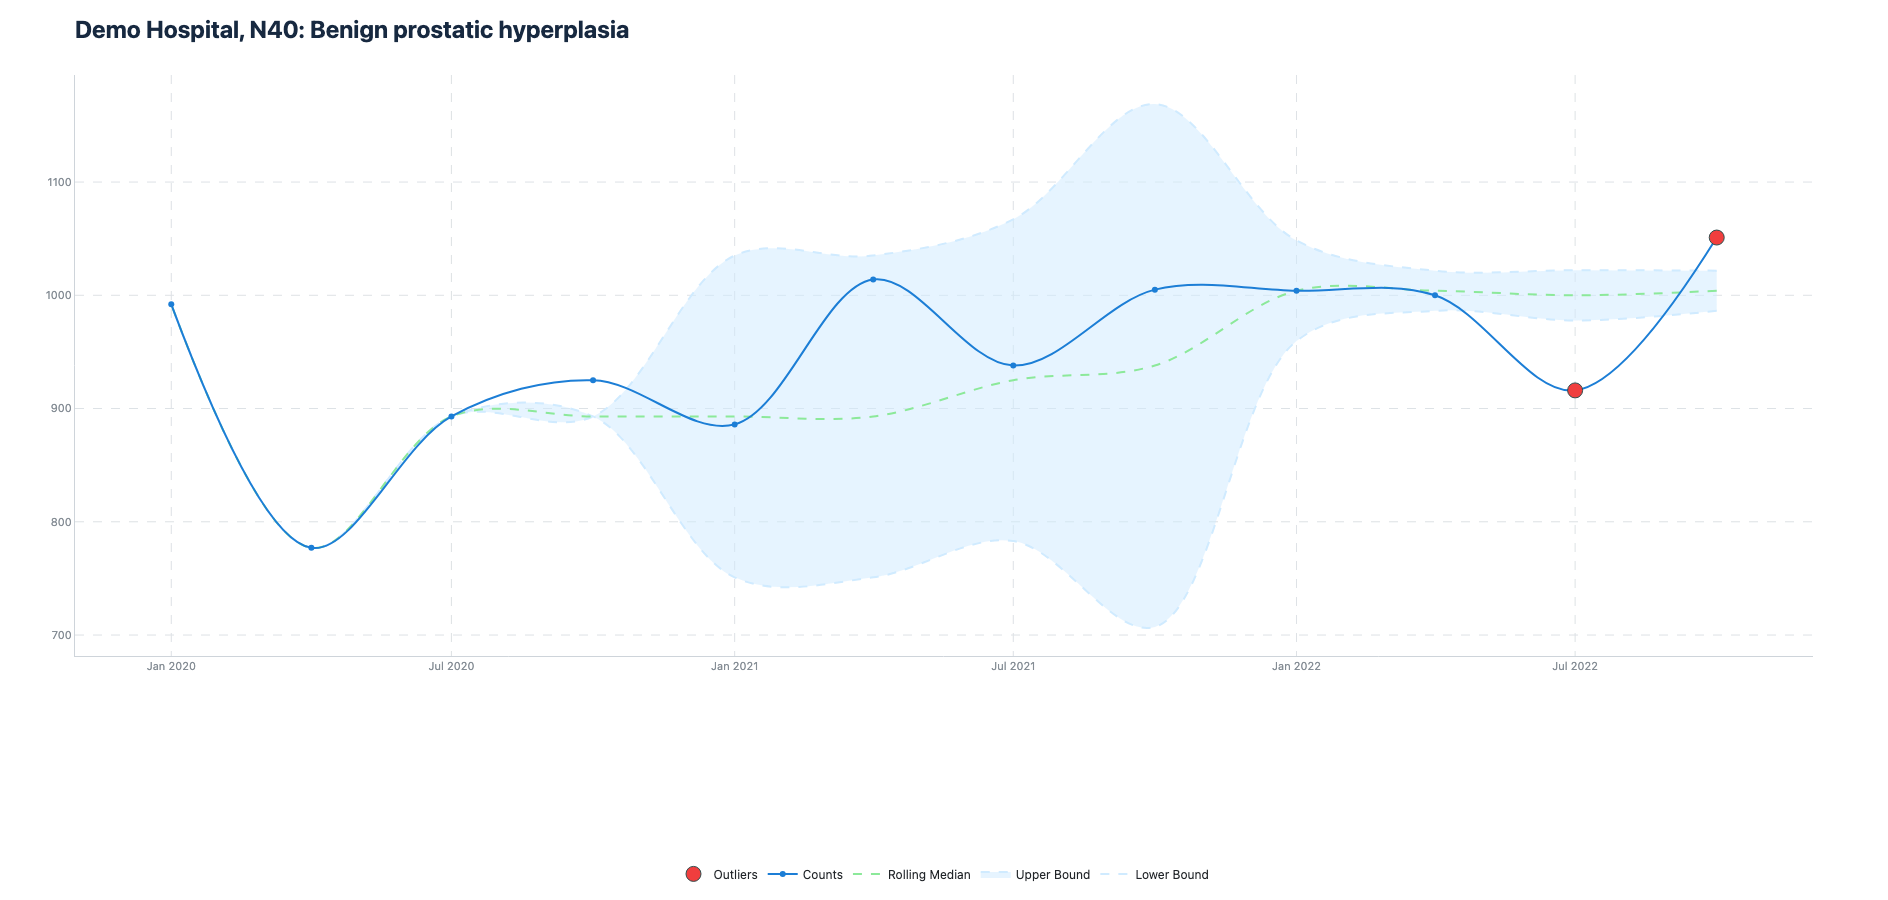
HQIP provides anomaly detection of diagnoses over time. Specifically, it provides a robust system capable of detecting spikes or dips in diagnoses that could indicate emerging health trends. Traditional statistical approaches struggled to balance sensitivity and specificity in identifying meaningful anomalies, prompting NewVolt to explore alternative methodologies.
NewVolt implements a signal detection tool leveraging the Hampel filter—a robust statistical technique for outlier detection. The Hampel filter identifies anomalies by comparing each data point against a rolling median and a scaled median absolute deviation (MAD). This approach provided a non-parametric, efficient means to flag unusual ICD-10 prefixes without making assumptions about the underlying data distribution.
- Data Preprocessing: Inpatient and outpatient datasets are cleaned and standardized using NewVolt's data management platform. The first 3-character prefix of the primary diagnosis code is then calculated for each encounter.
- Hampel Filter Application: A sliding window is applied to each ICD-10 prefix, with thresholds dynamically adjusted based on real-time data characteristics.
- Integration & Scalability: The tool is deployed within NewVolt’s analytics platform, leveraging cloud-based infrastructure for scalability and performance.
By integrating a Hampel filter-based signal detection tool, NewVolt enhances its ability to identify ICD-10 prefix outliers with improved accuracy and efficiency. This tool gives member facilities of HQI the ability to explore their own systems and discover insights about diagnoses.
Healthcare Disparities
There is growing interest in analyzing healthcare data across various demographic and socioeconomic groups. HQIP provides a generic framework for HQI hospitals to filter and analyze their patient encounter data by strata like Race, Age, Ethnicity, Sex, CMS Age Group, Patient Disposition, and more.
Social Determinants of Health (SDOH) provide insights into external factors like problems with homelessness, problems related to employment, and problems with literacy.
There is extensive work still to be done in this area and NewVolt continues to work with experts in this field like HQI and SpeedTrack to develop novel ways of investigating these types of healthcare disparities.
- Advanced Filtering & Stratification: Hospitals can slice patient encounter data by Race, Ethnicity, Age, Sex, Language, CMS Age Group, and Patient Disposition, among others.
- SDOH-Driven Insights: The framework incorporates SDOH data to highlight factors like economic instability, housing insecurity, and access to healthcare services.
- Scalable and Secure Infrastructure: Built on cloud-based architecture, the framework ensures secure handling of sensitive patient data while enabling seamless integration with hospital data sources.
This platform is now generally available for Hospital Associations.
Let's work together.
No automated emails, our team will reach out to you.